MuonTS: Timeseries Forecasting Part 1


A while ago I wrote a small Rust library implementing the Temporal Fusion Transformer model
based on the GluonTS implementation. At the time, I discovered the Burn ML framework, which I
found interesting, thus creating the crate muonts (a play on gluon and ts for timeseries).
At the time, the library was fairly new, so I only implemented this single model with the
primitives provided by the library (thanks to the Burn dev folks and @nathanielsimard).
I recently updated the old code to compile against the latest version of Burn. This also made me want to try out the current ecosystem. Back in the day, the science/ML ecosystem was rudimentary; now, with libraries like Polars (which I sometimes use from Python as I like the ergonomics better than Pandas), it seems like doing some simple forecasting tasks should fare a bit better.
All that being said, I’m going to use a Kaggle dataset (Store Sales) for testing.
Project Setup
The first thing on my list is to create the Rust project and start loading some of the data. Normally, this exploratory portion would be done with something like a Jupyter notebook, but I’ll start with some simple Rust code to load and manipulate the training data from the CSV file into a usable shape for running the model. I have previously done a quick exploratory analysis in a notebook, so more or less, I know what I want for starting.
So I created the Rust binary, added Polars as a dependency, and wrote some simple ‘hello world’ code to load the file:
use polars::prelude::*;

fn main() {
    let df = LazyCsvReader::new(PlRefPath::new("data/train.csv"))
        .finish()
        .unwrap();

    let head = df.limit(10)
        .collect().unwrap();

    println!("{head}");
}
First, I noticed how different the Rust API is from the Python one. Going through the docs,
there are some definitive trade-offs between using the Lazy vs Eager APIs, which are not an issue
in the Python version. My initial thought was to just load a frame and grab the top 10 rows
(using the head method in the Python API), but the Rust API does not directly have that. However,
limit will do. Having this piece of code, I proceeded to run it (cargo run -r), but
surprise, surprise: something did not compile. The offending piece, being part of the Polars
code, left me scratching my head.
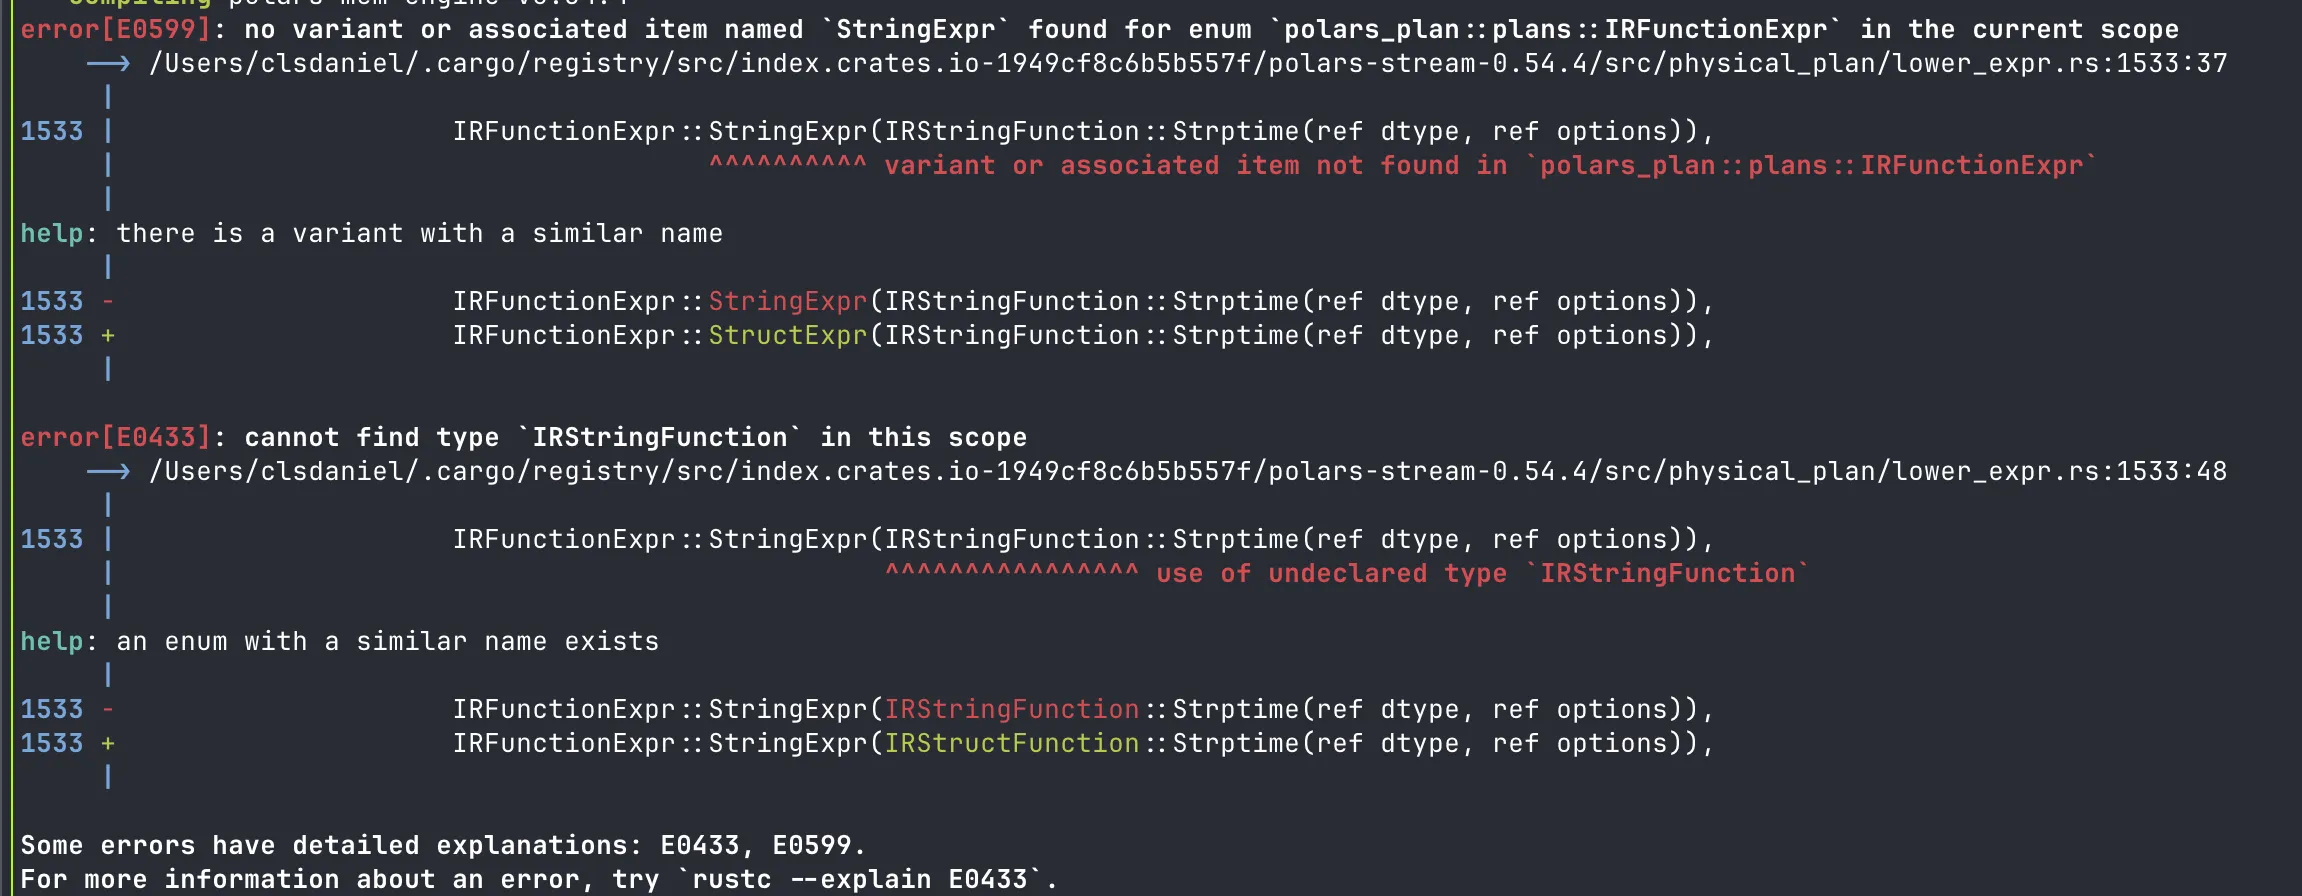
Turns out the default features I was compiling required me to add the "strings" (or "dtype-str") feature
(https://users.rust-lang.org/t/error-e0599-no-method-named-str-found-for-enum-expr-in-the-current-scope-help/116140)
With that out of the way, we have our frame ready to go:
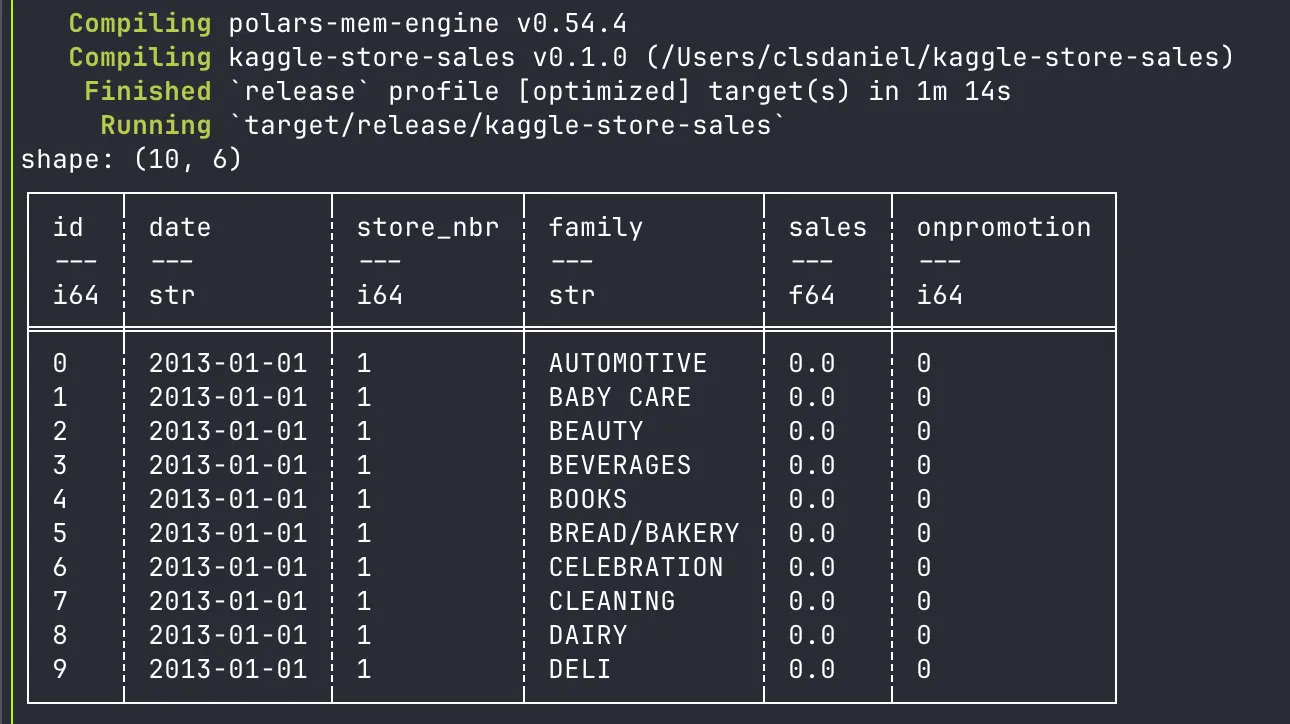
Regarding the columns and their meaning, I’ll quote the Kaggle entry on the data:
* store_nbr identifies the store at which the products are sold.
* family identifies the type of product sold.
* sales gives the total sales for a product family at a particular store at a given date. Fractional values are possible since products can be sold in fractional units (1.5 kg of cheese, for instance, as opposed to 1 bag of chips).
* onpromotion gives the total number of items in a product family that were being promoted at a store at a given date.
This leaves out id, which seems like a row ID/number to me. This gets confusing later on as
the Kaggle entry provides a sample output format and test data which also has an id column,
but that actually identifies the individual prediction rows (date, store, and product family combinations)
rather than the timeseries itself.
Anyway, to plug this data into the model, we need to group the timeseries by date per unique timeseries. In this case, I’ll group by store and family:
let data = df.group_by([col("store_nbr"), col("family")])
    .agg([col("date"), col("sales")])
    .collect()
    .unwrap();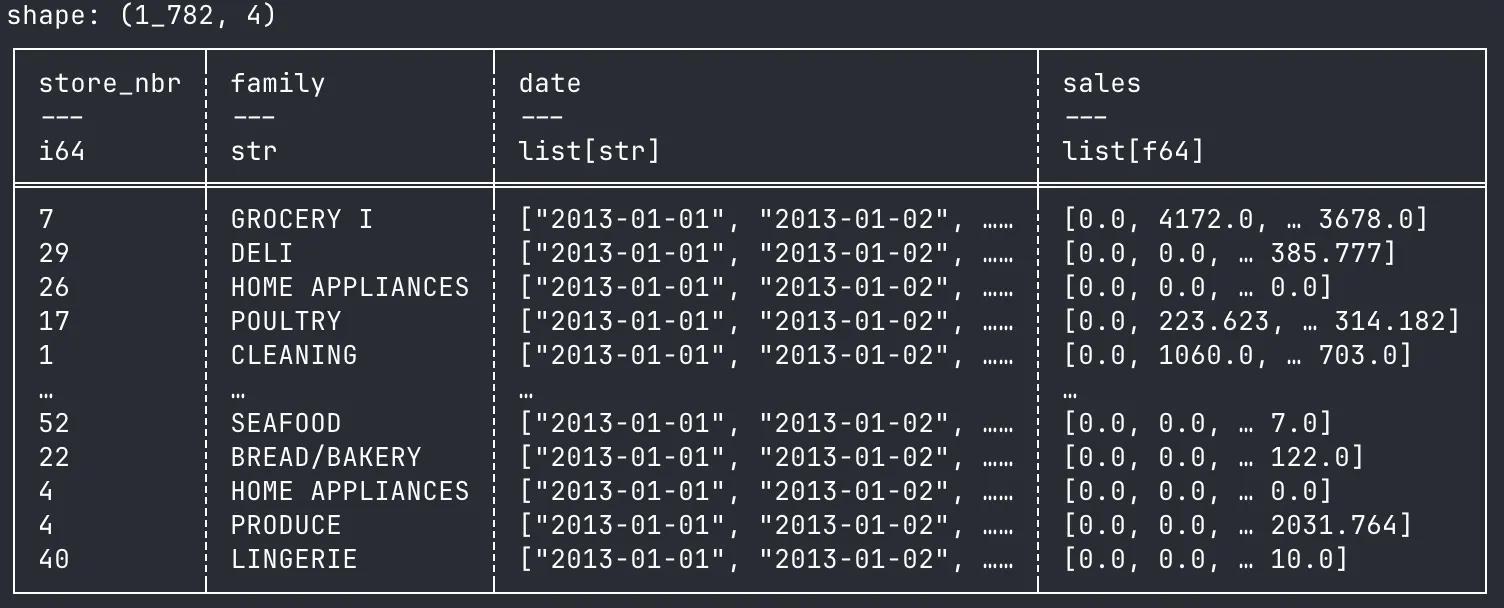
One caveat is that the data is already sorted by the grouping fields and date; thus, the array
is sorted in the correct order. It would, in general, be advisable to sort the dates before grouping
since date is not part of the group-by fields.
Now the next hurdle is to extract the data from the Polars dataframe. There are some cookbooks that show some data extraction samples, but they only work on regular types, while my data is aggregated into lists (or arrays).
In the end, I found two workable ways. One is to extract the value as a Series per row; this is done
by calling a function by row number per column (get(n) and get_as_series(n)). The other way
is to use a column series iterator (series_iter()), extract each value as a float (by downcasting via .f32()),
and collect them as Vec<Vec<f64>>. I found the second option a bit more ergonomic when using the iterators.
So now that we have the data as vectors, can we feed it to the model? Not quite. I’ll be using the
Temporal Fusion Transformer model I implemented in MuonTS. This model requires several inputs
which are grouped under the struct BatchItem:
pub struct BatchItem<B: Backend> {
    pub past_target: Tensor<B, 2>,
    pub past_observed_values: Tensor<B, 2>,
    pub future_target: Tensor<B, 2>,
    pub future_observed_values: Tensor<B, 2>,
    pub feat_static_real: Option<Tensor<B, 2>>,
    pub feat_static_cat: Option<Tensor<B, 2, Int>>,
    pub feat_dynamic_real: Option<Tensor<B, 3>>,
    pub feat_dynamic_cat: Option<Tensor<B, 3, Int>>,
    pub past_feat_dynamic_real: Option<Tensor<B, 3>>,
    pub past_feat_dynamic_cat: Option<Tensor<B, 3, Int>>,
}
So I’ll explain each field in a bit of detail.
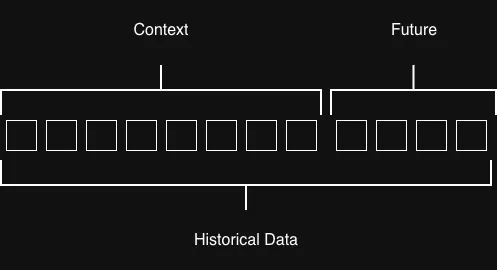
The field past_target basically refers to the historical data (the context from which the model
will learn or predict). This input is a 2D tensor with shape [batch_size, context_length], where
batch_size is the number of timeseries we are going to process at the same time, while
context_length is the size of the context/history we want the model to use. This is fixed in
the model configuration, so we should match that setting.
The field past_observed_values is basically a mask with the same shape as past_target. Because
there are no specific padding values in this model for missing data, this mask tensor is used. For
values in past_target at a given position, the value in past_observed_values is 1.0 if the
value is observed, or 0.0 if not (meaning the data is missing). This causes the model to ignore the
missing values.
The field future_target basically refers to the “future” data used to train the model. This tensor must
be of shape [batch_size, prediction_length]. The prediction_length is configured in the model, so
this must match that.
The field future_observed_values is also a mask for the future_target field, with the same
meaning as past_observed_values.
So given these parameters, where do we get this “future” data? Well, for training purposes, you split your historical data into a historical portion and a future portion. The idea is that we use the historical portion to train the model (generating a prediction), then calculate a loss against the future data, and then the optimizer adjusts the model weights to improve the prediction.
With that set, what about the other fields? In the struct, they are marked as optional. However,
the model actually requires at least feat_static_real, feat_static_cat, and feat_dynamic_real
to be set. The fact that they are marked as optional is merely a byproduct of my initial implementation (based
on how GluonTS implements this part). If we skip them, the model has issues running. So for now,
we’ll fill in some dummy values (1.0). This will not cause issues since this model also learns
the importance of each feature and adjusts accordingly, so this dummy feature will not affect the
output.
Both feat_static_real and feat_static_cat are 2D tensors with shape [batch_size, n_feat].
For the dummy value, we’ll set it to [batch_size, 1] (so only a single dummy feature). These
“static” features have a single value per timeseries (i.e., they are not time-dependent).
For feat_dynamic_real (since it is a 3D tensor with shape [batch_size, total_length, n_feat]),
this means that it is time-dependent. The interesting thing here is the total_length; this
means that the feature must be context_length + prediction_length in size. We need to
know the value of the feature both in the past and in the future (which is important
to consider, since this applies to prediction too). For the dummy value, we’ll generate
a tensor of 1.0 of shape [batch_size, total_length, 1].
Once we have the data in the right shape, we implement the Batcher trait to plug our data into
the training facilities within Burn.
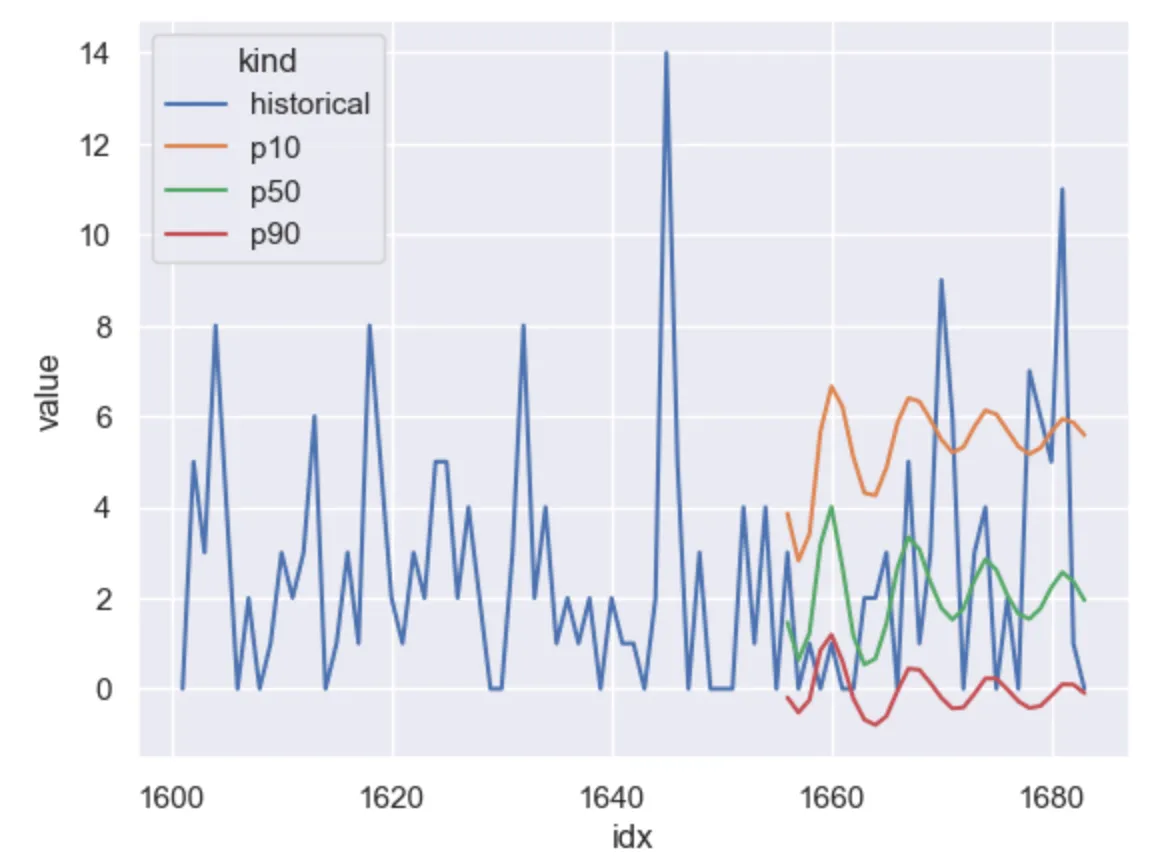
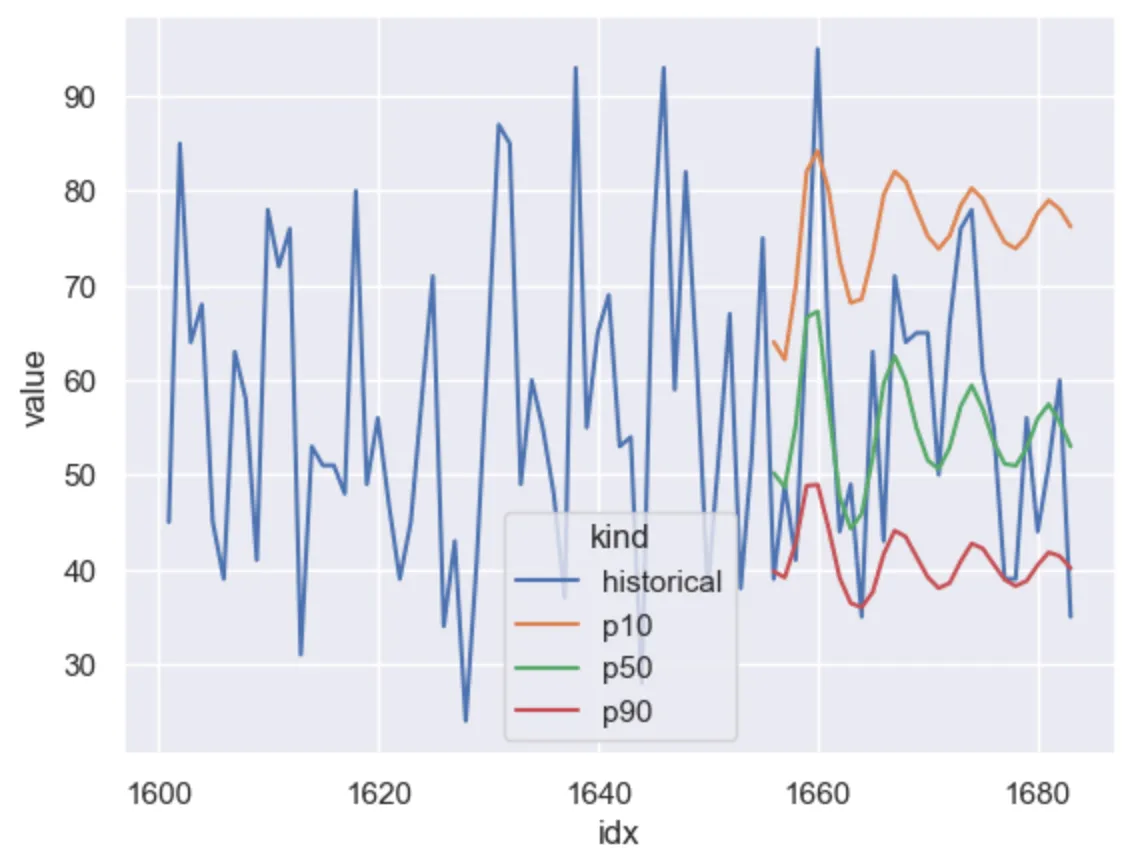
In my first pass, I only fed one sample for each timeseries, biased towards the end of the series. With a context length of 56 and prediction length of 28 (roughly 4 weeks of daily predictions and 8 weeks of historical context for training), I ran it for 10 epochs. With no other features, the results already look promising:
Current code so far https://github.com/clsdaniel/kaggle-store-sales/tree/4abc5cd05f73e76b3c878da71de28b76de6685ca
For the next post, I’ll start fine-tuning the model by improving the training datasets (sliding windows) and exploring additional features.
Comments
Loading comments from Mastodon...